Screenshots and Walkthrough
Here is what a normal workday looks like in Crona: see the day, choose the next issue, focus, then look back at what happened.
1. Summary: get your bearings
Section titled “1. Summary: get your bearings”The Summary view is the quick read-only entry point for a selected day. It combines focus time, issue and habit progress, daily-plan signals, check-in information, and Momentum without opening editing controls. Use , and . to move between dates, or g to return to today.
2. Daily: choose the work
Section titled “2. Daily: choose the work”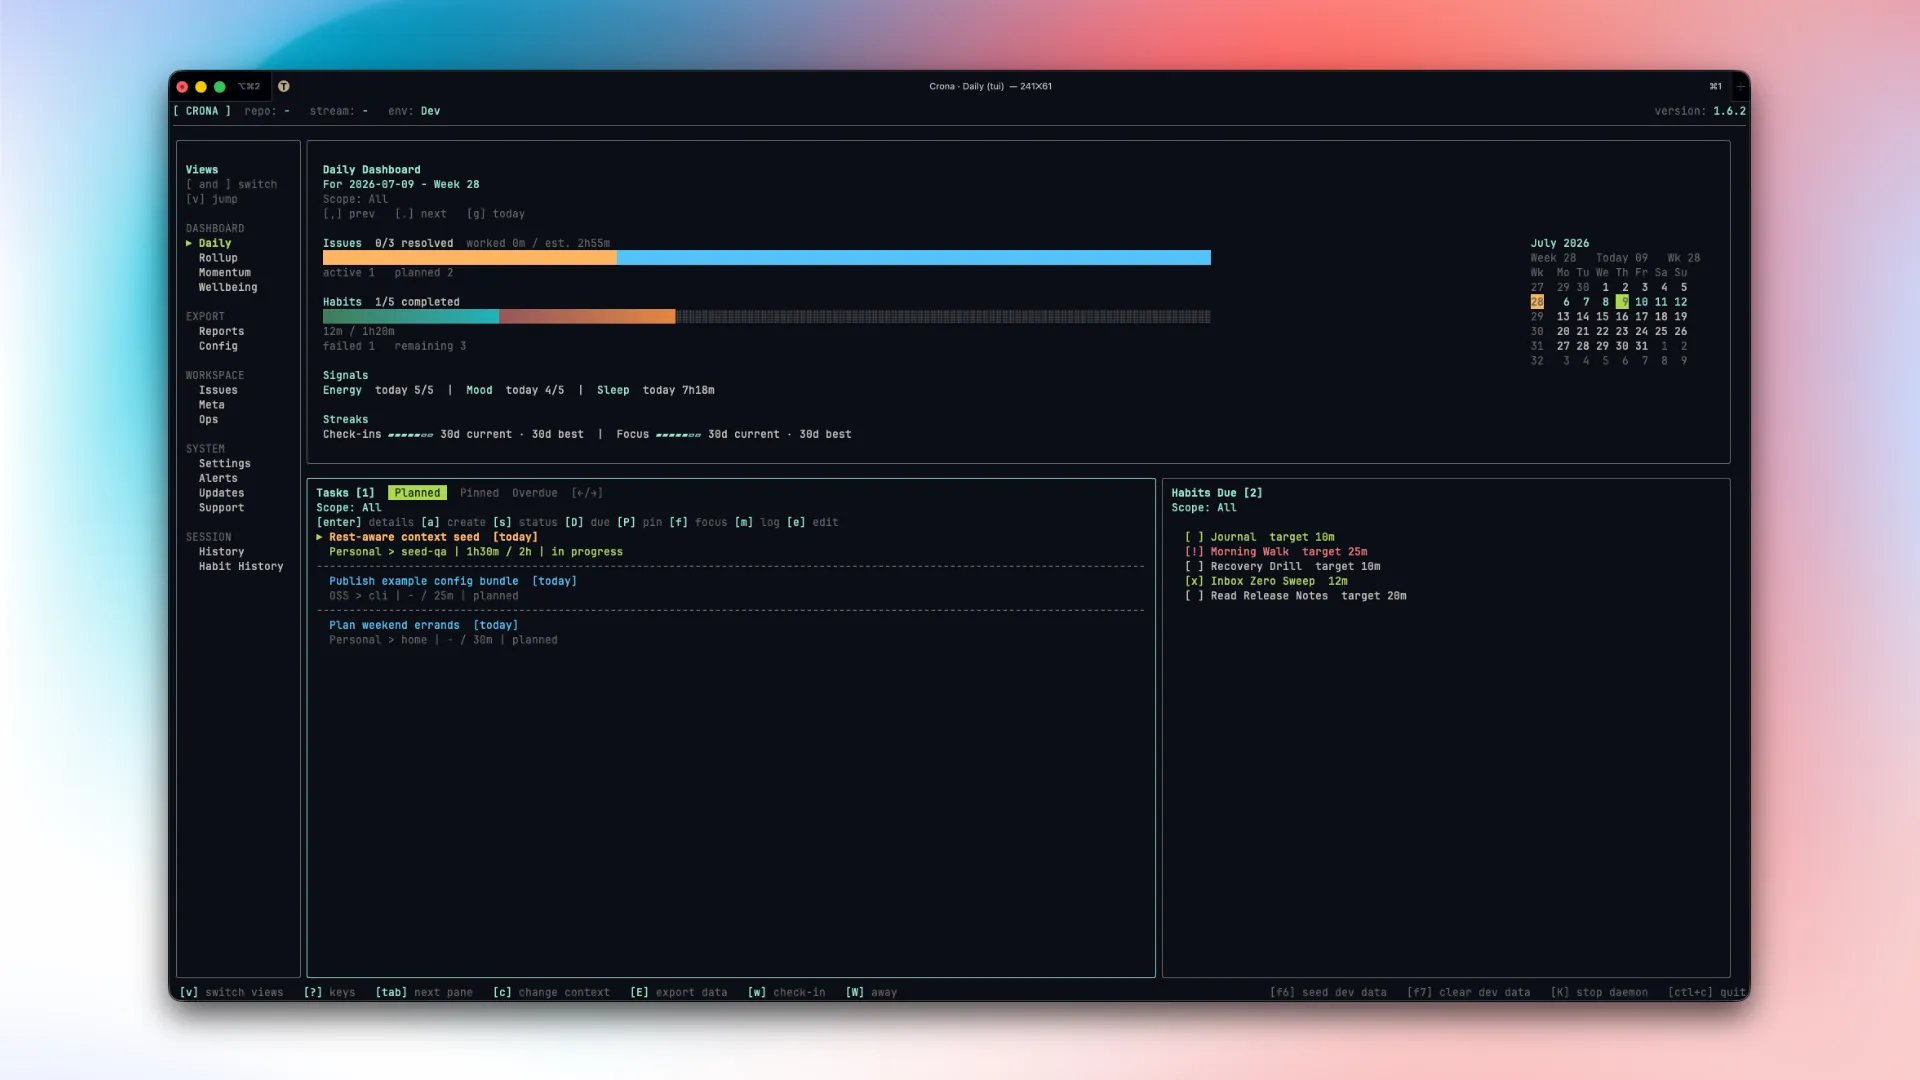
The Daily dashboard displays active contexts and tasks scheduled for the selected day:
- Navigation: Move back and forth across calendar dates.
- Sectioning: Segregates planned issues, pinned issues, overdue issues, and due habits.
- Summary Header: Visual progress indicators displaying active context, total daily focus time, completed issue ratios, and current Momentum signals.
3. Issues: keep the backlog usable
Section titled “3. Issues: keep the backlog usable”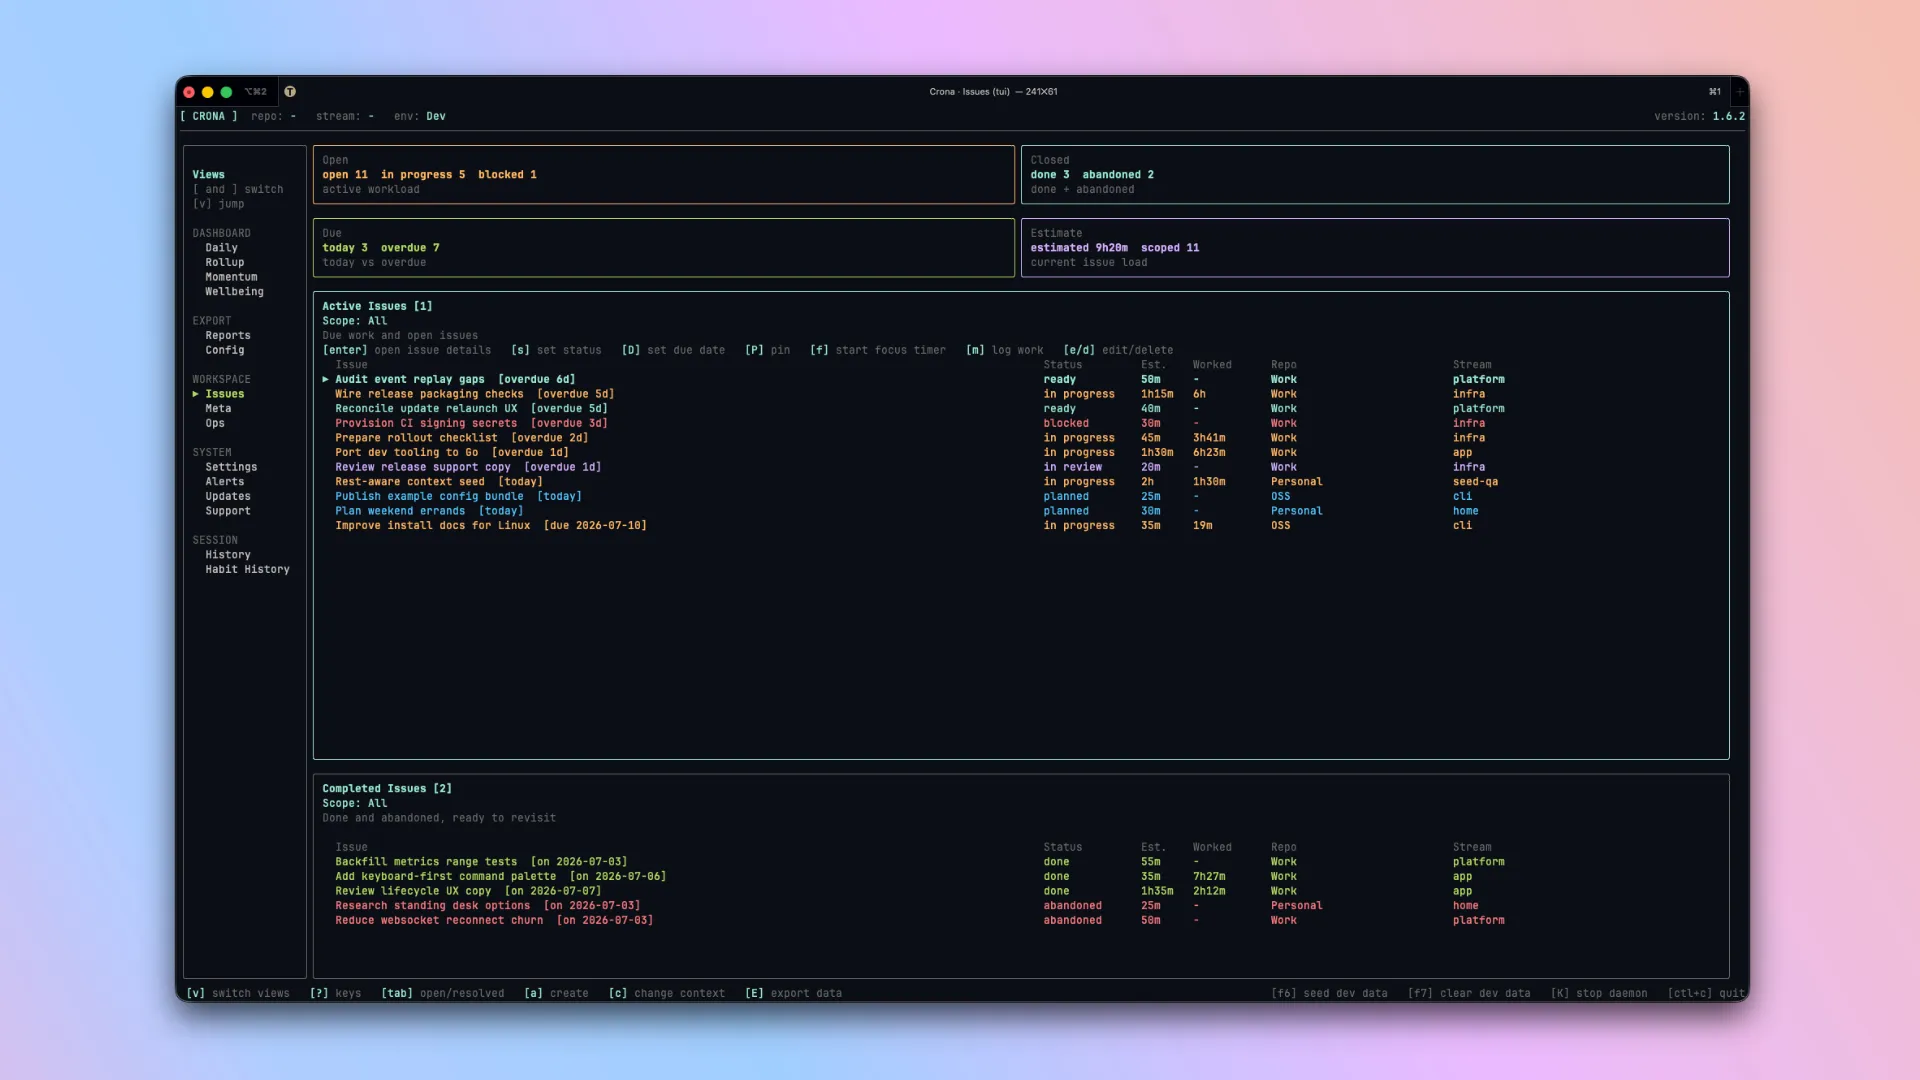
The Issues workspace manages the task list:
- Tabs: Quick toggle between Active (
1) and Completed (2) tasks. - Table Data: Visualizes issue state, estimated vs. actual worked time, planning dates, and context path.
- Control: Allows changing state, editing task notes, editing estimates, checking out issues, or triggering issue-aware focus sessions directly.
4. Rollup: look back without reconstructing the day
Section titled “4. Rollup: look back without reconstructing the day”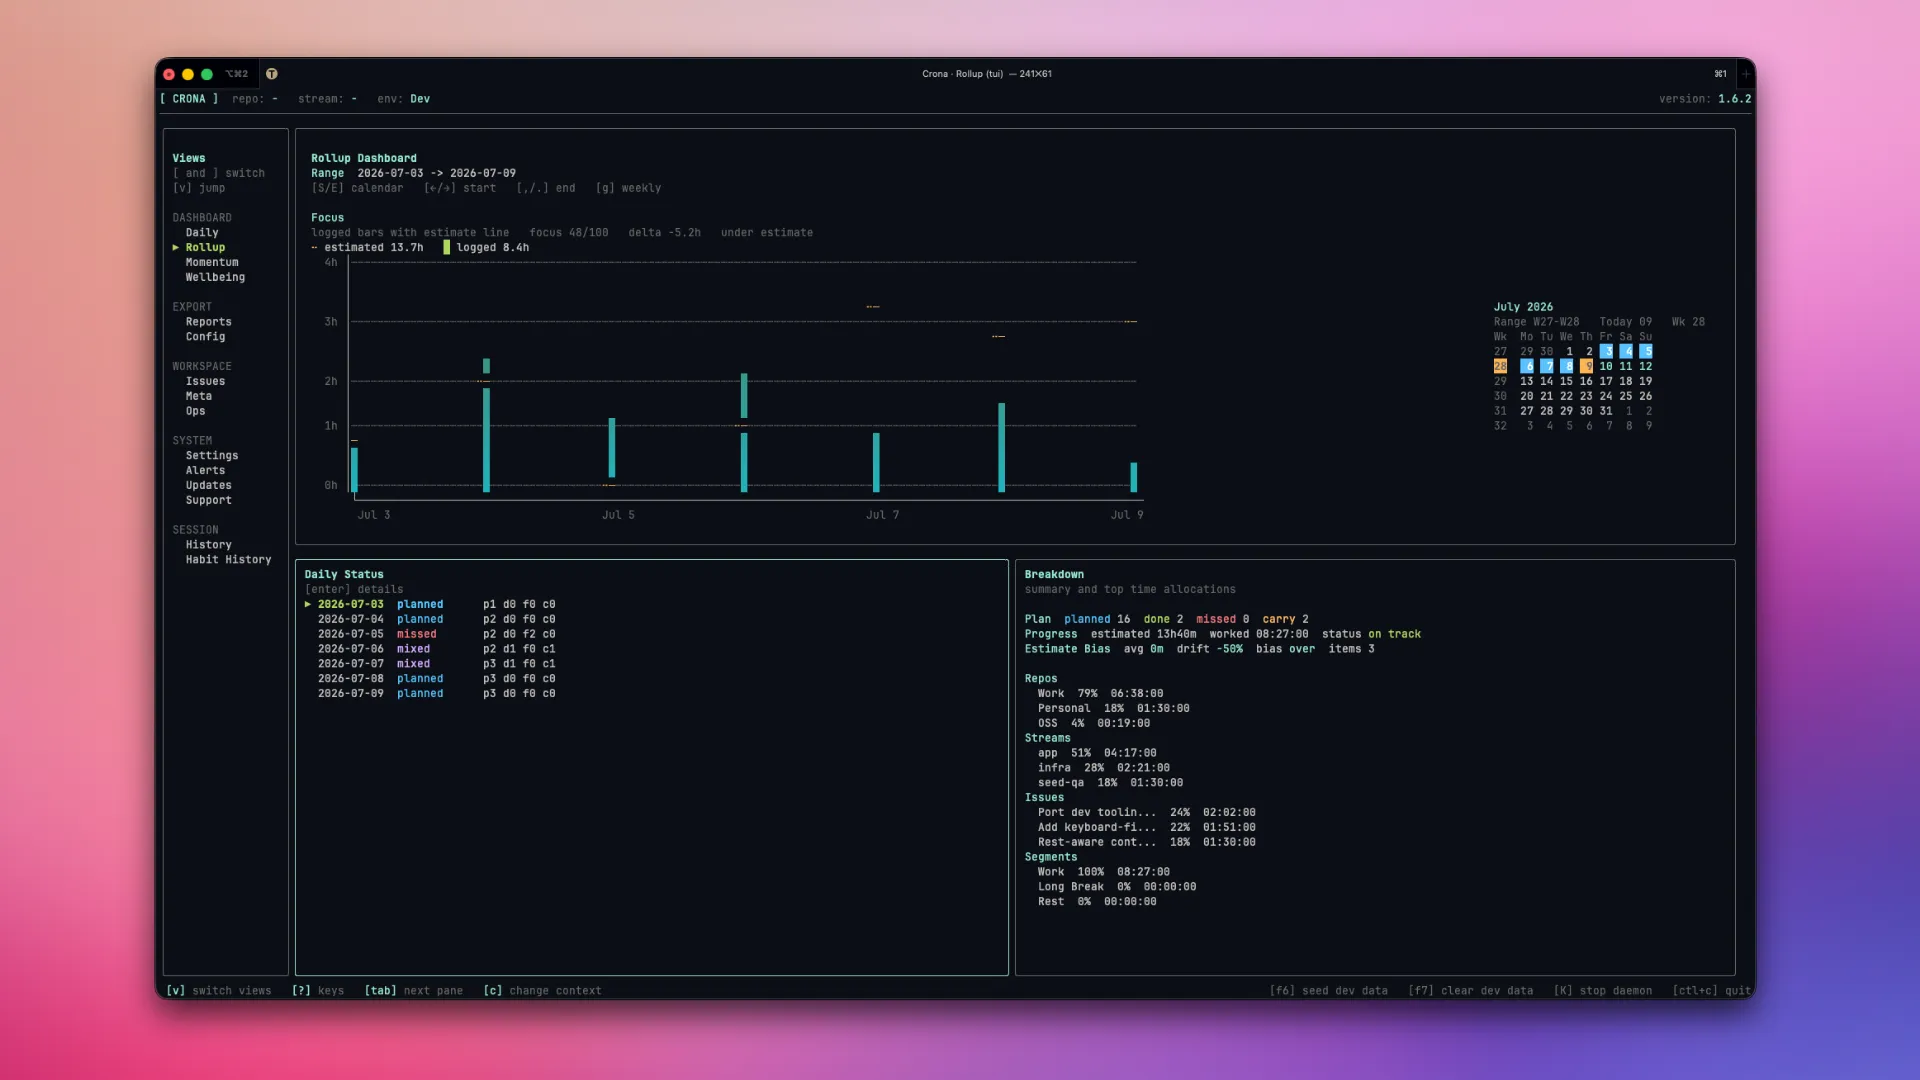
The Rollup dashboard acts as a visual timeline:
- Focus Chart: A character-based graph representing focus session intervals.
- Breakdown: Scrollable lists detailing exact session boundaries, metadata, and task-specific durations.
- Ratios: Compares estimates with recorded focus time to help you plan the next round more honestly.
5. Wellbeing and Momentum: add context
Section titled “5. Wellbeing and Momentum: add context”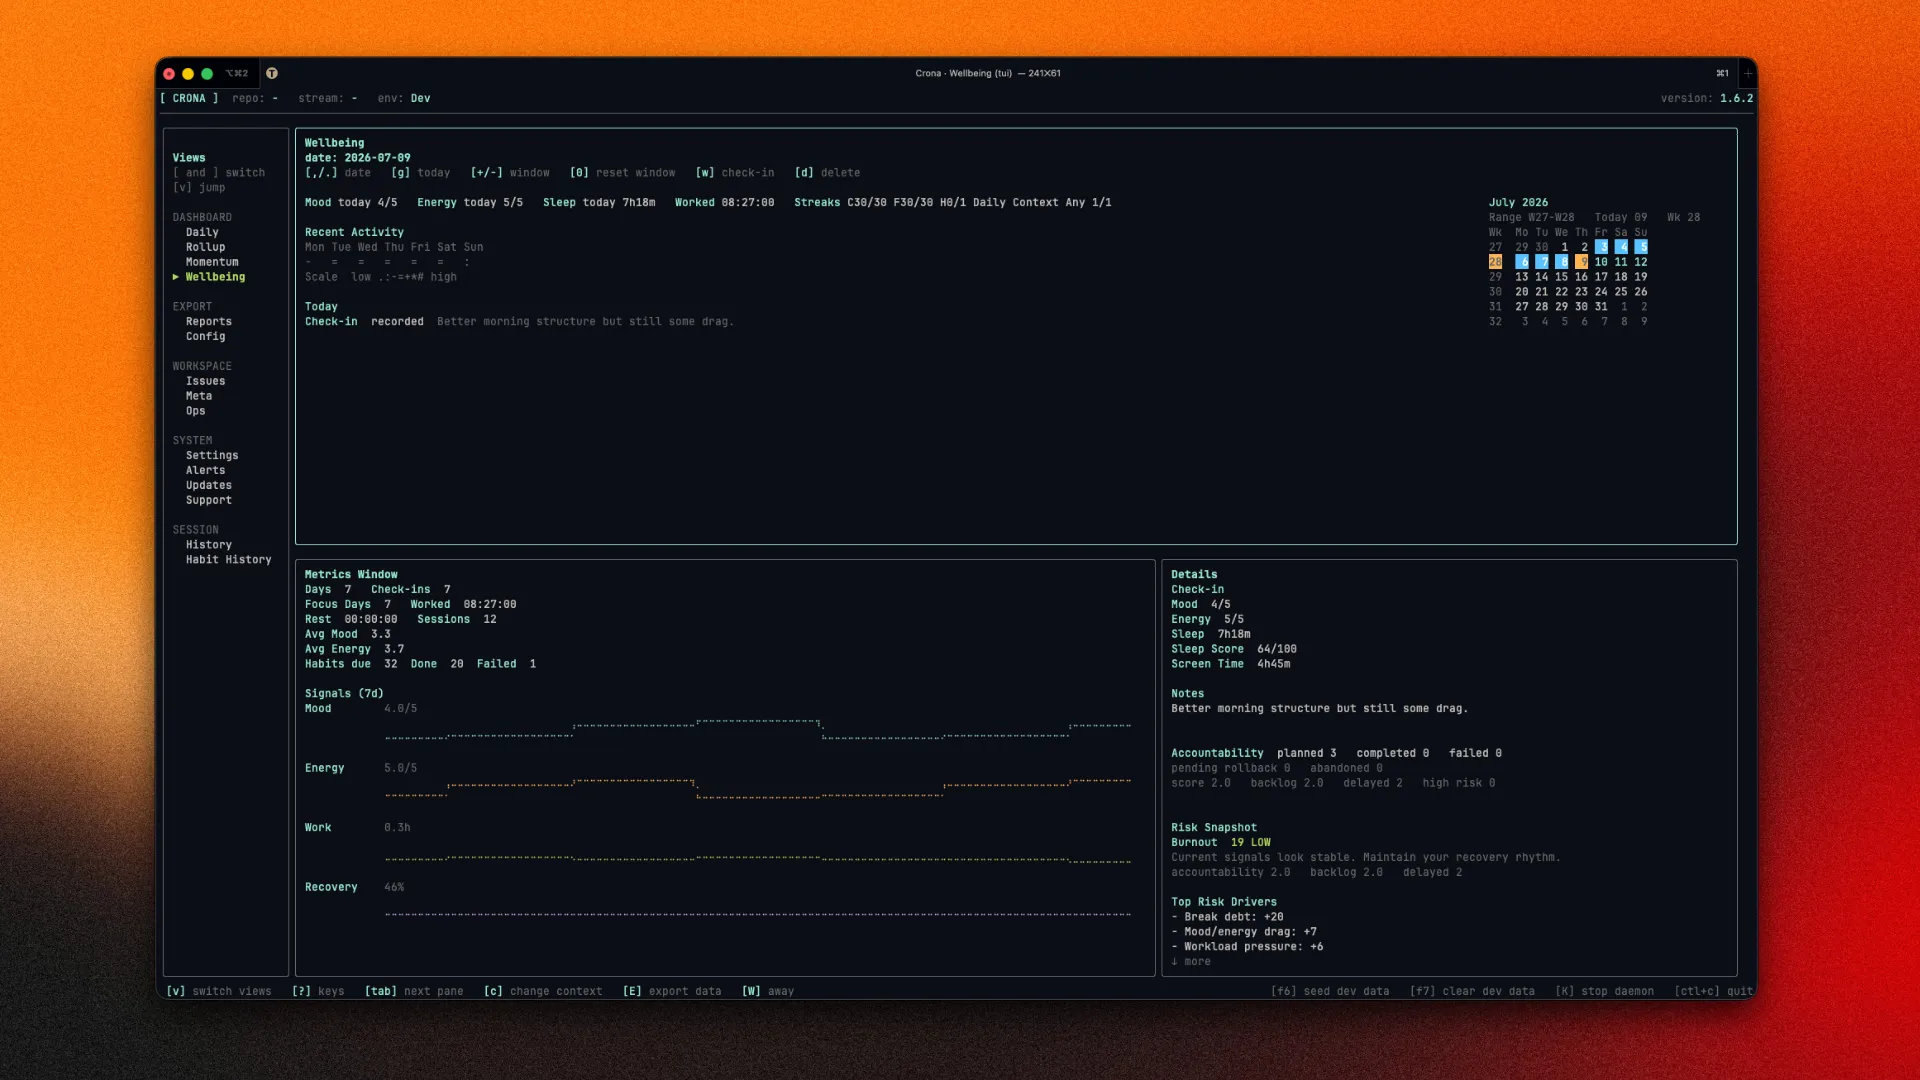
The Wellbeing panel handles human metrics:
- Check-ins: Displays daily mood, energy, sleep hours, sleep scores, and screen time metrics.
- Metrics Grid: Visualizes a 7-day rolling window of activity.
- Momentum Ladders: Displays milestone blocks for active daily, weekly, or monthly Momentum along with protected-day and adjusted-target context.
- Signals: Local trends bring rest, focus, habits, and check-ins into the same view so you can notice when the week is becoming unsustainable.